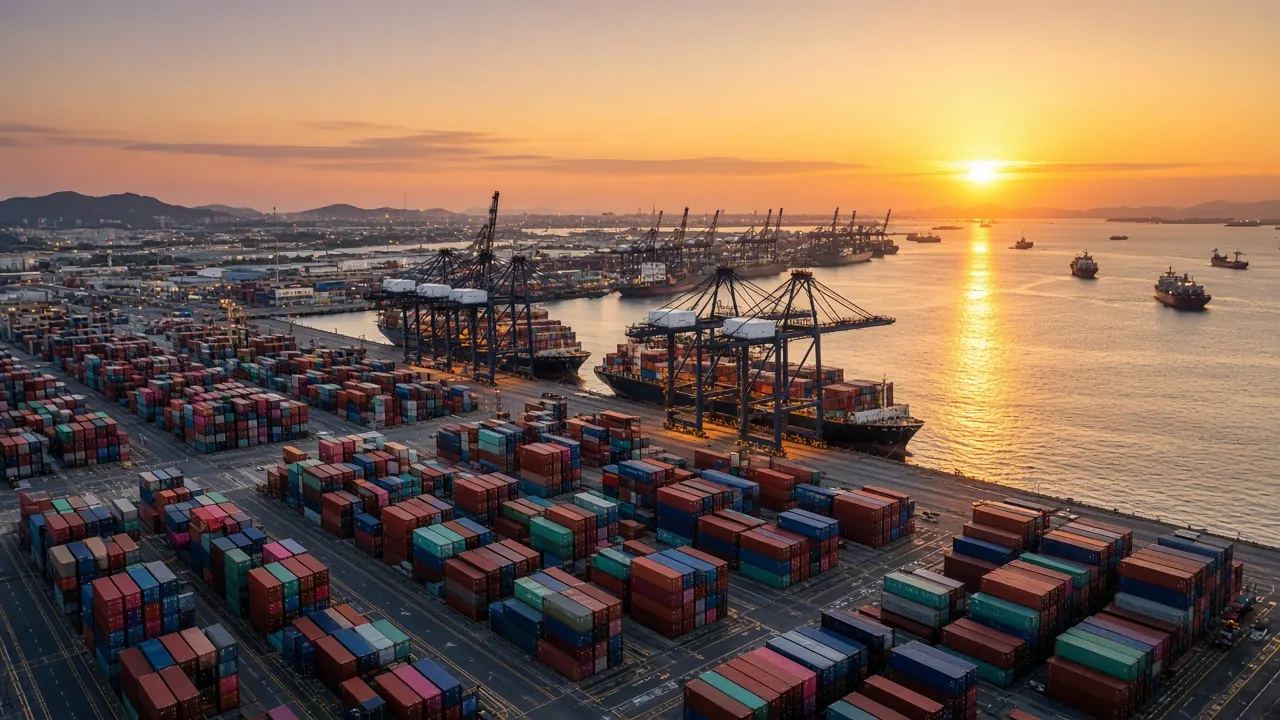
Open economies buy and sell across borders. Trade lets countries specialise where they are relatively more productive and import what others produce at lower opportunity cost. That idea, comparative advantage, is older than most modern politics and still underpins why trade can raise average living standards even when it disrupts particular industries.
Comparative advantage, not just absolute advantage
A country can be worse at producing everything in absolute terms and still gain from trade by specialising in what it does least badly, or most well relative to the alternatives. Opportunity cost is the key. Trade in practice also reflects scale economies, supply chains, and geography, not only a textbook model with two goods.
The opportunity cost and comparative advantage calculator turns two output numbers into the opportunity cost of each good, then compares two producers for absolute advantage, comparative advantage, and a terms of trade range. You type the outputs. It does not download trade statistics, and it is not advice about tariffs or agreements. A bowed curve, where that cost rises as you make more of one good, is drawn on the production possibilities curve explainer. The calculator uses the straight line case.
Balances and what they mean
The trade balance is exports minus imports of goods and services. A trade deficit means imports exceed exports. A surplus means the opposite. The broader current account also includes income flows and transfers. In the textbook a deficit is financed by a capital inflow: foreign purchases of domestic assets, or lending. The published accounts add a capital account and a statistical discrepancy before the two sides match, and a minus on the US financial account means net borrowing, not a second deficit.
The worked second quarter of 2026 is net exports and capital flows. The Bureau of Economic Analysis release of 24 September 2026 rounds the US current account to a deficit of 246.0 billion dollars. The Office for National Statistics bulletin of 30 September 2026 puts the UK current account deficit, including precious metals, at 19.9 billion pounds. Neither release makes the financial account line an exact copy of that deficit. How to sort a single transaction, before you add the totals, is the balance of payments page.
A deficit is not a verdict, and a surplus is not a prize. Persistent deficits can sit next to strong domestic investment demand, or next to weak competitiveness. Growth, employment, and whether the financing continues are separate questions. This page does not answer them, and it is not advice about a currency or a bond.
Exchange rates
An exchange rate is the price of one currency in terms of another. A stronger pound or dollar makes imports cheaper and exports dearer in foreign markets, other things equal. Floating rates, like sterling and the dollar in normal times, move with trade flows, interest differentials, risk appetite, and expectations.
Comparisons of purchasing power over long periods sometimes use real exchange rates that adjust for inflation differentials.
The purchasing power parity calculator turns two basket prices into a PPP rate, compares that rate with a market quote, and computes a real exchange rate. You type the numbers. It does not download a live rate.
UK and US profiles
The United States runs a goods trade deficit alongside a services surplus in the accounts linked below. The United Kingdom is a services heavy trader, with deep financial and professional service exports. Goods trade and European supply chains remain important. Energy and commodity prices swing both countries' nominal balances. Read the dated quarter on the net exports and capital flows page rather than a slogan about which deficit is "the" deficit. The United States and United Kingdom pages list the agencies.
Illustrative only: if UK imports of goods exceed exports while services exports are strong, the overall trade picture can look very different from a goods headline. The ONS bulletin for April to June 2026, linked from the explainer, is the place to check the current split. Do not treat this sentence as that release.
Policy instruments
Tariffs, quotas, subsidies, and trade agreements change relative prices and market access. They redistribute between consumers, producers, and trading partners. Retaliation risk and the complexity of supply chains mean a headline tariff rate rarely tells the full cost story.
Explore GDP (net exports as a component), supply and demand (world prices), and glossary terms comparative advantage, current account, and exchange rate.
Sources
- BEA: International trade and investment
- ONS: Balance of payments
- World Bank: Trade (% of GDP)
- FRED: US/UK exchange rate
- IMF Data
Check another page in this cluster
Go deeper: exchange rates and purchasing power parity, net exports and capital flows.